2026 US Midterm Prediction Markets: Kalshi vs Polymarket
Kalshi vs Polymarket in the 2026 US midterm prediction markets: $61.4M in weekly notional volume, whale trades, wallet concentration and Senate races to watch.

PF Weekly #012 · The money behind the US midterms
This week’s letter breaks down the money behind the 2026 US midterm prediction markets, comparing Kalshi and Polymarket trading volumes, large trades, wallet concentration and the Senate races to watch.
2026 midterm odds: Senate and House control
In the TruthIndex snapshot shown below, Democrats have a 68.5% chance of controlling the Senate and a 92.4% chance of controlling the House, according to Nijinn’s TruthIndex.
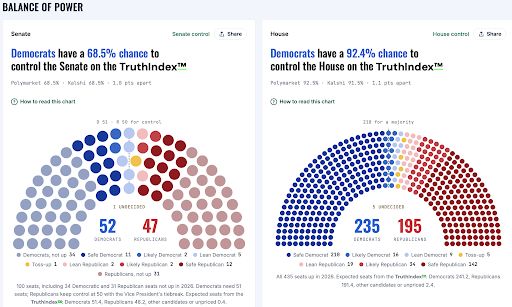
Nijinn’s map puts 52 Senate seats in the Democratic column if the current favourites win, one more than the 51 needed for control. Texas and Maine are the closest of those favoured races.
Weekly midterm trading volume grew roughly 30-fold
Combined weekly midterms notional volume rose from about $2 million in the week of January 5 to $61.4 million in the week of October 5. Kalshi contributed $47.2 million in that October week, approximately 77% of the combined total.
This difference is interesting to observe as we’ve previously seen activity picking up towards the resolution date. With the US midterms approaching, we expect to see more volume in the coming week, especially in state races perceived as decisive.
The notional figure measures contracts traded at their $1 payout value. It measures something different from the cash paid for those contracts or fresh money deposited, a distinction we examine in our Q3 2026 prediction markets report.
Kalshi vs Polymarket: where large midterm trades happen
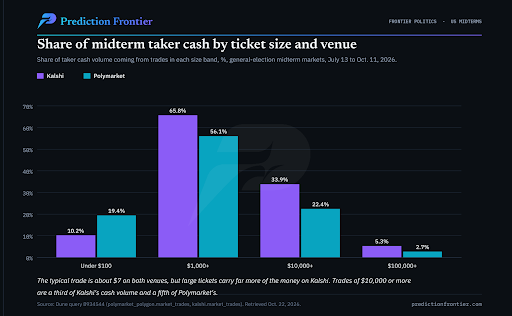
The cash figures show better how the venues compare. Between July 13 and October 11, Kalshi took 639,184 taker trades on general-election markets worth $83.4 million in cash. Polymarket took 450,691 worth $26.9 million.
The median ticket is almost identical: $7.60 on Kalshi and $7.03 on Polymarket.
What’s more intriguing is that trades of $10,000 or more make up 33.9% of Kalshi’s cash volume and 22.4% of Polymarket’s. Trades of $100,000 or more account for 5.3% against 2.7%.
Polymarket’s top 1% hold 86% of midterm position value
On October 18, 57,205 wallets held open positions on Polymarket’s midterm general-election markets, worth $39.9 million at current prices and $100.3 million if every position paid out. The median wallet held about 10 cents. The 90th percentile held $104.
The top 572 wallets hold 86.0% of the value, the top 100 hold 56.5%, and the top 10 hold 22.9%. The single largest wallet holds $3.47 million in one balance-of-power market. That is close to 9% of all open midterm position value on the venue, sitting in one position.
Midterm race volumes: lifetime totals vs weekly activity
In the October 22 race snapshot, California governor led lifetime trading outside the two chamber-control markets at $63.1 million combined, with Xavier Becerra priced at 97%. The Los Angeles mayor runoff followed at $47.0 million, with Nithya Raman around 51%. Texas Senate was third at $40.7 million.
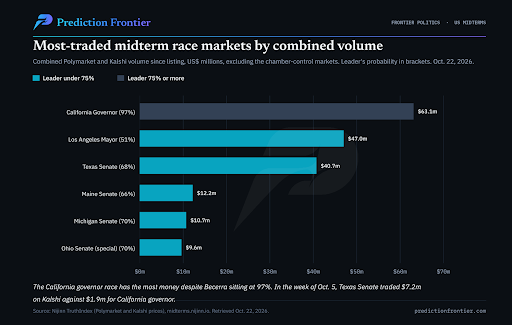
The weekly comparison put Texas ahead. In the week of October 5, it traded $7.2 million of notional on Kalshi alone, nearly four times California governor’s $1.9 million. Michigan Senate traded $1.4 million and Maine $1.0 million.
California led the accumulated totals. Texas drew substantially more trading that week.
Races to watch: Texas, Maine and Senate control
Nijinn’s 52-seat Democratic scenario includes both Texas and Maine. If Democrats win the other 50 seats in their column, either state would deliver a majority. Winning both would give them 52.
Those are the two races alongside the Senate-control contract to watch as election day approaches. Whether their prices move together, or begin to diverge, is a comparison worth following.
Data sources and snapshot dates
The election outlook and October 22 race comparisons draw on Nijinn’s TruthIndex election tracker. Prediction Frontier’s trading and wallet analysis uses Dune data. Weekly notional figures refer to the weeks stated above; the taker-trade comparison covers July 13–October 11, 2026, and the open-position snapshot is dated October 18, 2026. These are historical snapshots and do not update with live market prices.
For the wider market context, read our Q3 2026 prediction markets sector report or explore the Prediction Frontier markets dashboard.