2026 World Cup Prediction Markets: Kalshi vs Polymarket
Prediction Frontier measured $5.95B in World Cup cash trading on Polymarket and reconstructed $2.95B on Kalshi. Explore volume, pricing and methodology.

Research by Andrew Lujan Odera and Edwin Munyui · Original report: 28 July 2026 · Version 1.1
Prediction Frontier measured approximately $5.95 billion in cash trading on Polymarket’s selected 2026 World Cup markets and reconstructed approximately $2.95 billion on Kalshi. On that basis, Polymarket traded about twice as much cash across match, team-to-advance and overall-winner markets.
The headline figures tell a different story. Kalshi reported roughly $12 billion in face-value contract volume, while Polymarket’s roughly $6 billion reflected dollars matched at execution prices. Comparing the two requires a common measurement convention.
This is a web summary of Prediction Frontier’s 2026 World Cup special report, with selected charts and findings from the original research.
Kalshi vs Polymarket World Cup volume: headline figures and cash traded
| Volume measure | Polymarket | Kalshi |
|---|---|---|
| Headline volume | Approximately $6B, dollars matched at execution prices | Approximately $12B, contracts counted at $1 face value |
| Prediction Frontier cash estimate | Approximately $5.95B measured on-chain | Approximately $2.95B reconstructed from candlesticks |
These figures cover the World Cup markets selected for the report. Kalshi’s cash figure uses trading volume multiplied by mean trade price at the market-day level. Polymarket’s taker-side fills measure the dollars exchanged at execution prices. The difference in reporting conventions explains why the ranking changes when the comparison moves from venue headline totals to cash traded.
Daily World Cup trading peaked before the final
Polymarket’s daily World Cup cash volume ran between approximately $130 million and $200 million through much of the group stage and peaked near $248 million on 7 July. Kalshi’s highest day was approximately $151 million on 6 July. The busiest sessions came in the fixture-heavy part of the tournament.
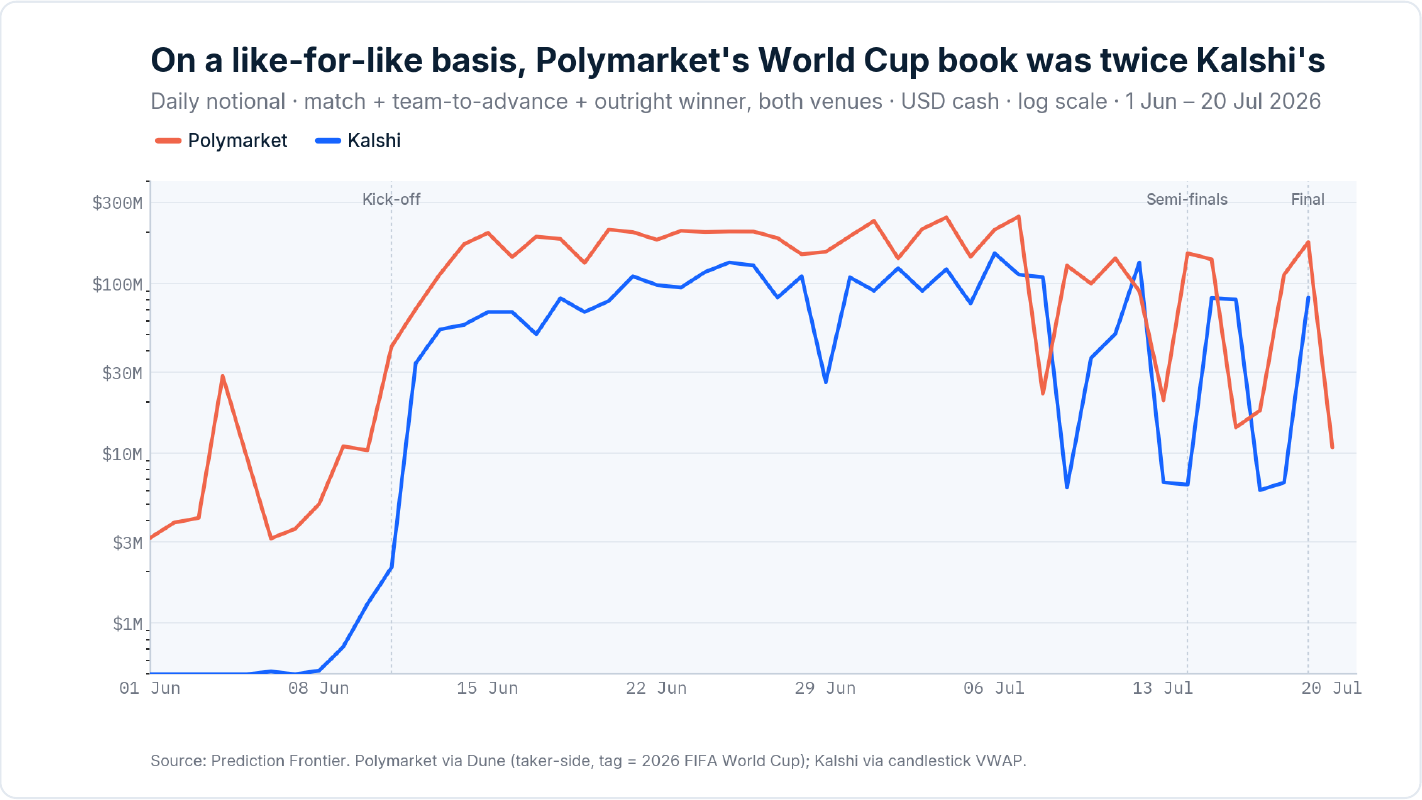
Source: Prediction Frontier World Cup report, section 2.1. Polymarket taker-side trades via Dune; Kalshi cash reconstructed from candlestick prices. The vertical axis uses a logarithmic scale.
World Cup prediction market volume by tournament stage
The group stage was the largest trading window on both venues. Prediction Frontier measured approximately $2.83 billion on Polymarket and $1.32 billion on Kalshi across 72 matches in seventeen days. Activity generally declined as the schedule thinned through the knockout rounds.
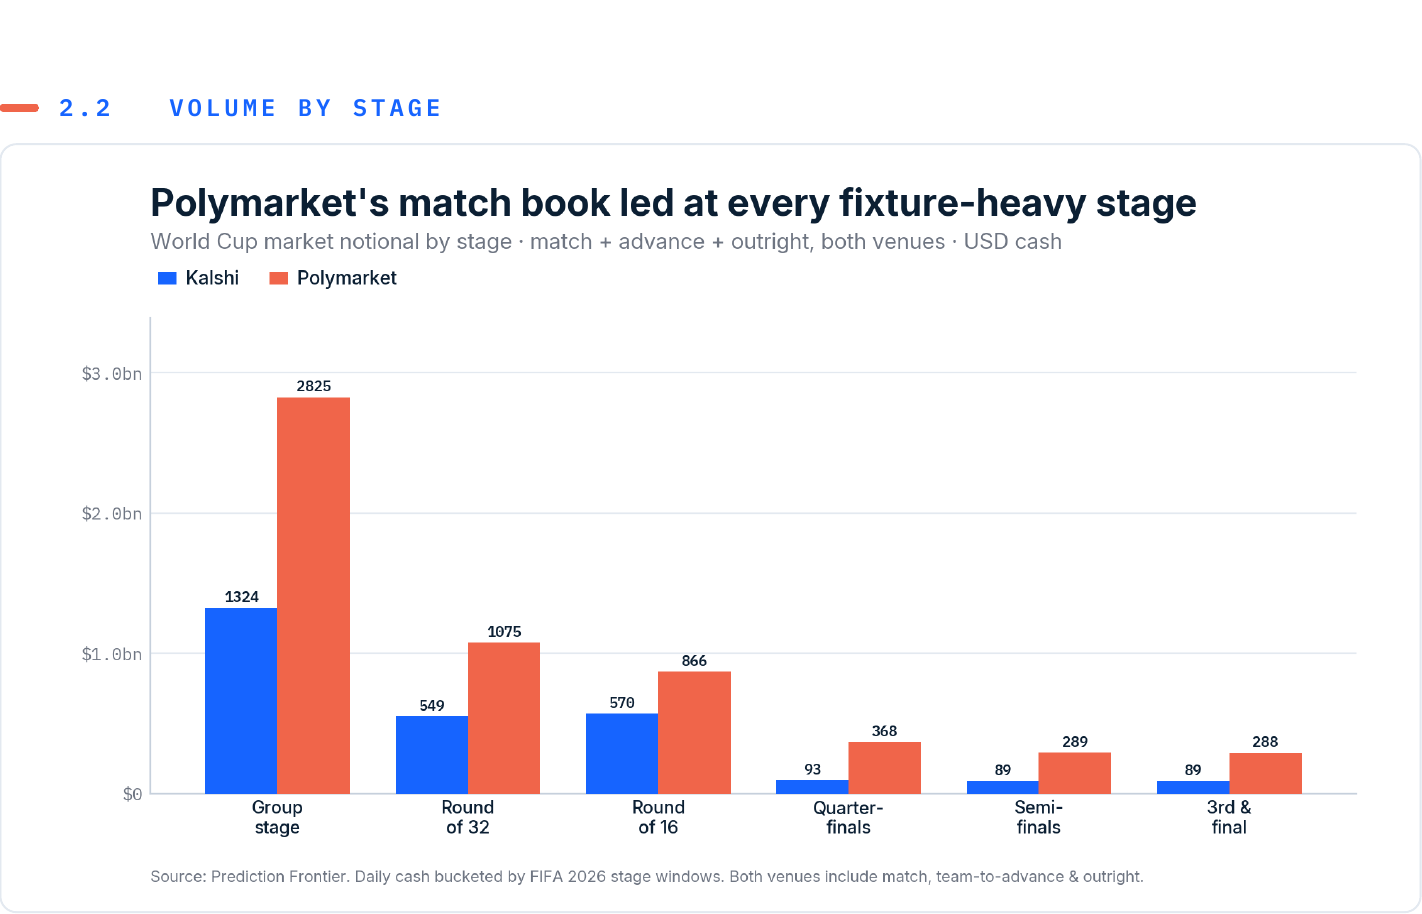
Source: Prediction Frontier World Cup report, section 2.2. Both venues include match, team-to-advance and overall-winner markets.
Stage | Window, 2026 | Kalshi cash | Polymarket cash |
|---|---|---|---|
Group stage | 11–27 June | $1.32B | $2.83B |
Round of 32 | 28 June–3 July | $549M | $1.08B |
Round of 16 | 4–8 July | $570M | $866M |
Quarter-finals | 9–11 July | $93M | $368M |
Semi-finals | 14–15 July | $89M | $289M |
Third place and final | 18–19 July | $89M | $288M |
Figures are rounded. Stage windows exclude inter-round rest days, so these buckets do not cover every day in the full measurement period.
Trading volume and win probability told different stories
In Polymarket’s overall-winner book, Argentina attracted approximately $174 million, Egypt $159 million and Morocco $152 million. Spain ranked fourth by volume. The eventual champion was therefore not the most-traded team.
Prediction Frontier’s report tracked Spain’s implied probability from roughly 17% at kickoff to 58% in the final week. Trading volume showed where activity concentrated; prices showed the market’s changing assessment of the outcome. Reading the two separately was a central finding of the report.
Sources, definitions and limitations
Polymarket figures come from taker-side CLOB fills in polymarket_polygon.market_trades on Dune, counting each matched trade once. Market tags identify World Cup match, team-to-advance and outright contracts, excluding Club World Cup, women’s and cricket variants. The daily comparison chart spans 1 June–20 July 2026.
Kalshi figures cover the KXWCGAME, KXWCADVANCE and KXMENWORLDCUP series. Prediction Frontier reconstructed daily cash using volume multiplied by mean trade price for each market-day across 422 markets. This is an estimate based on candlestick prices. The Polymarket Games tag may include a small share of game-level props, and stage attribution follows the calendar windows shown above.
The full definitions, reconciliation notes and external source list appear in the appendix to the 24-page World Cup prediction markets report.
Follow the post-World Cup sports market
The report identified returning traders and activity after the tournament as the next tests. Prediction Frontier’s Q3 2026 prediction markets report examines the following quarter. Our Polymarket sports and esports volume report and October Kalshi and Polymarket sports analysis follow trading across the regular sports calendar.
For institutional and professional market participants. Prediction Frontier publishes data for information only; nothing here is investment, trading or betting advice.