Prediction Frontier Weekly Prediction Markets Data Brief
The week resolves to one clean fact: liquidity and information are decoupling. World Cup volume fell 19%, order-book depth fell 46%, but open interest only fell 8.5% — capital held its positions while casual flow evaporated, which is a sign of a market concentrating rather than losing conviction.
$165.6M World Cup Winner 7-day volume (Polymarket) −19% vs last week | −46% World Cup order-book depth field halved 8 → 4 | 4 semifinalists = FIFA top-4 a World Cup first | $300B all-time cross-venue notional volume 9 venues (Dune) |
Executive Summary
Prediction markets had their first down week of the World Cup tournament, and the reason was structural, not a loss of interest. Polymarket's FIFA World Cup Winner market turned over $165.6M in the seven days to July 13 — a 19% drop from the prior week's $204.6M. The quarterfinals staged only four matches against the round of 16's eight, and — decisively — every pre-tournament favourite survived, so the market was denied the shock repricings that a Brazil or Portugal upset delivered a week earlier. Fewer games and fewer surprises likely meant fewer opportunities and upside incentive to trade.
The order book tells the sharper story: depth collapsed 46% to $29.4M as four deep contender books — Switzerland's $12.5M chief among them — closed the moment those teams were eliminated, and market makers pulled quotes on a field narrowing toward resolution. Open interest fell a milder 8.5% to $61.5M, signalling that most users exited the market. However, we might see renewed interest this week with the semifinals underway.
The World Cup’s surviving top bracket now includes France (38.9%), England (21.5%), Spain (20.5%) and Argentina (18.3%) as the four semifinalists — the first World Cup in history whose last four are the top four FIFA-ranked nations. England was the week's mover, jumping +6.5 points in a day after a Jude Bellingham brace saw off Erling Haaland's Norway in extra time; the eliminated quartet (Norway, Switzerland, Morocco, Belgium) were all 2–6% longshots, which is why quarterfinal odds-destruction averaged 3.1 points versus the round of 16's 5.3 — favourites winning simply wipes out less implied probability.
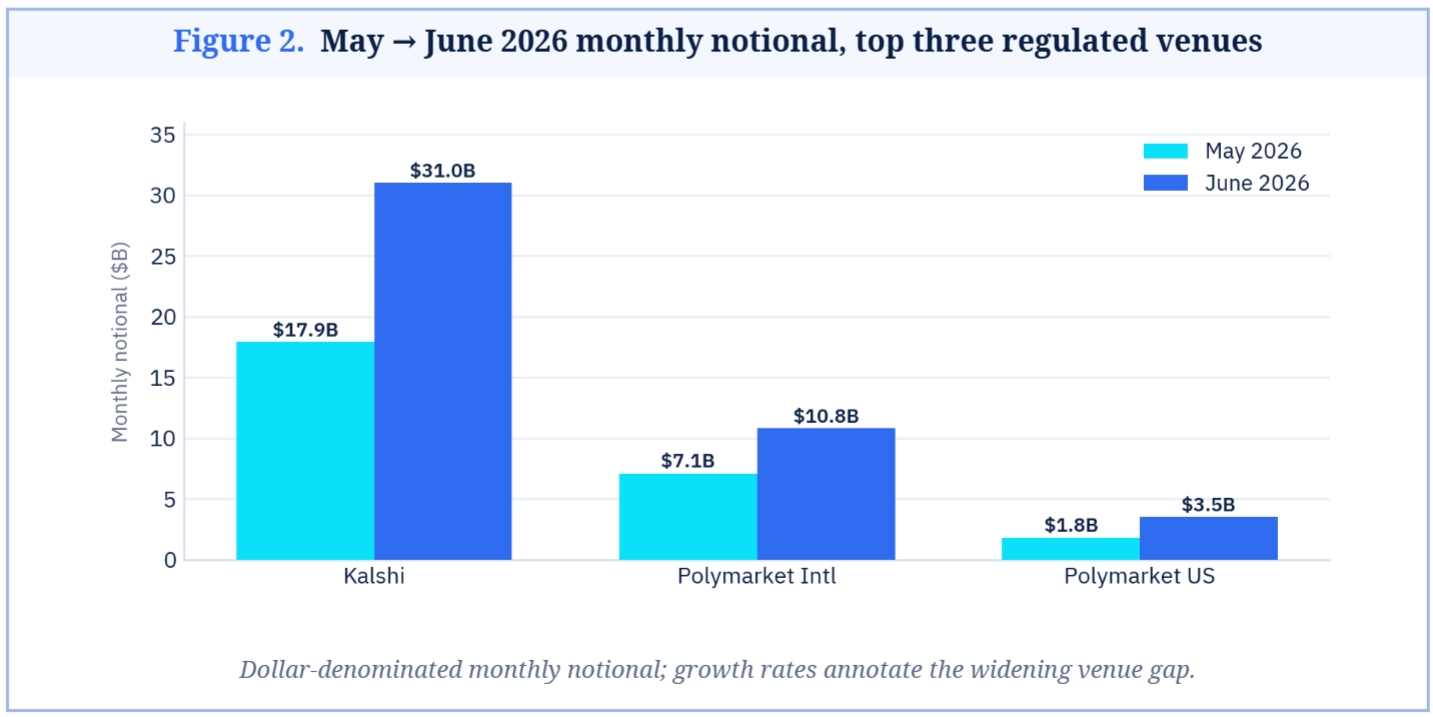
Underneath the tournament, the venue map widened. June's cross-venue notional cleared roughly $47B — Kalshi $31B, Polymarket International $10.8B, Polymarket US $3.5B — but the number worth watching is Rothera, the Susquehanna–Robinhood venture that launched in June, which cleared $2B in its first month and already accounts for about 7% of US prediction-market volume. Away from sport, Bitcoin downside hedging ($1.9M, led by the $50K-dip market) and a sharp Russian advance on Kostyantynivka — which repriced the July-31 capture market +19.5 points in a single day — were the only non-sports stories with a pulse.
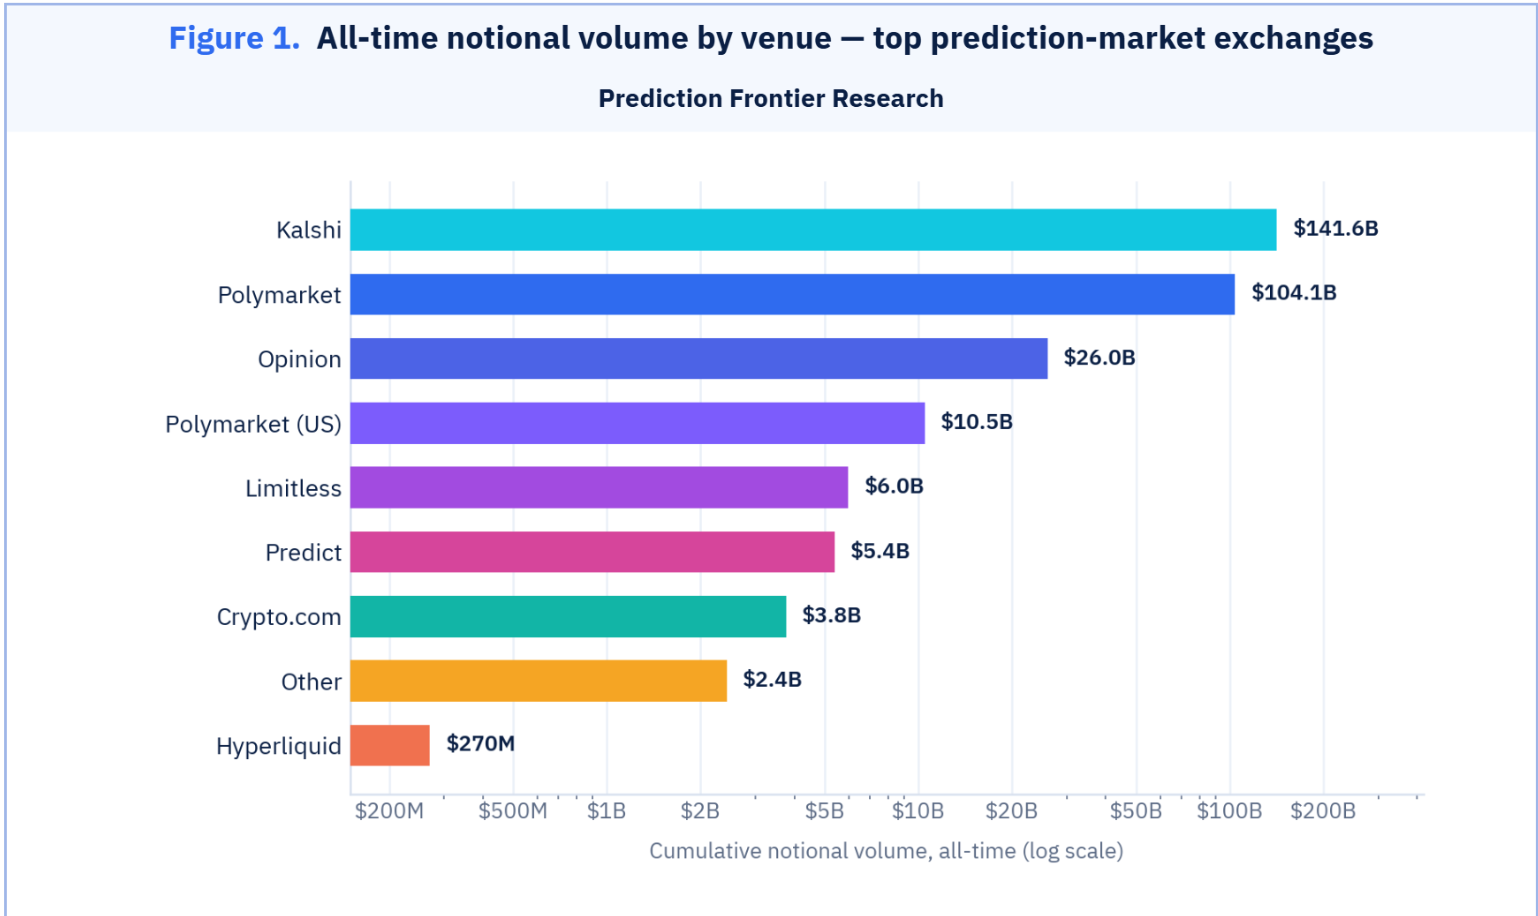
Dune Analytics data puts the sector's all-time cross-venue notional at $300B across nine venues — a market far broader than the Kalshi–Polymarket duopoly the headlines imply, with Opinion ($26B) already the third-largest book and a long tail of on-chain challengers.
Numbers This Week
The headline figures below are read for what caused them, not merely defined; each chart that follows isolates a single force behind the week. World Cup market data is pulled from Polymarket.
$165.6M WC Winner 7-day volume −19.1% WoW | $4.21B WC Winner lifetime volume up from $4.12B | $61.5M WC Winner open interest −8.5% WoW | $29.4M WC Winner order-book depth −45.5% WoW |
$141.6B Kalshi all-time notional (Dune) No. 1 venue | $26.0B Opinion all-time notional (Dune) No. 3 venue | $1.91M Bitcoin ladder 7-day flat WoW | +19.5pt Kostyantynivka Jul-31, 1 day frontline advance |
The single most important number is the 19% week-on-week fall in World Cup volume, because it answers the question of whether the tournament's flow is durable or event-driven. Evidently, it is largely event-driven: volumes track the match calendar almost one-for-one. With matches halved from eight to four, it explains why the turnover might have reduced despite thrilling quarter-final rounds (two extra-time thrillers) and more dramatic plays than most of the round of 16. For prediction market platforms chasing market leadership on the back of sport, that dependency is the key risk the post-tournament weeks will test.
A broader venue map
Prediction markets are not a two-horse story, and the Dune data make that concrete. Kalshi ($141.6B) and Polymarket ($104.1B) are ~82% of all-time notional, but Opinion is the surprise at $26.0B — a larger cumulative book than Polymarket's own US venue ($10.5B) — and beneath them sits a genuine long tail: Limitless ($6.0B), Predict ($5.4B), Crypto.com ($3.8B), the grouped 'Other' venues ($2.4B) and Hyperliquid ($0.3B). Distribution-led and on-chain challengers already clear billions in aggregate, so the competitive threat to the leaders is broader than the headline duopoly suggests.
Rothera — a Susquehanna–Robinhood joint venture that did not exist in May- cleared $2B in June and took roughly 7% of US volume by routing Robinhood's World Cup order flow. A revelation of how quickly distribution, not technology, redraws this market: whoever owns the funnel to retail is likely to materialise a share in a shorter go-to-market time frame.
Across the tracked venues, the cumulative volume ladder looks like this:
The month-on-month growth shows an intriguing comparison between Kalshi’s and Polymarket’s growth. Kalshi's +73% (from $17.9B) outpaced Polymarket International's +53% (from $7.08B), widening the leader's edge. Most of the volumes on Kalshi came from the World Cup flow and other sports (80%), while Polymarket’s sports accounted for 39%.
One would have expected Polymarket to reap big on the World Cup given their global presence, but it seems the World Cup location (USA, Canada and Mexico) largely favored Kalshi’s user base, not to mention their strategic branding partnership with ADI Predictstreet (the official prediction market partner of the FIFA WORLD CUP 2026).
The month-on-month dollar view shows where the momentum sits:
Where the week's money actually went
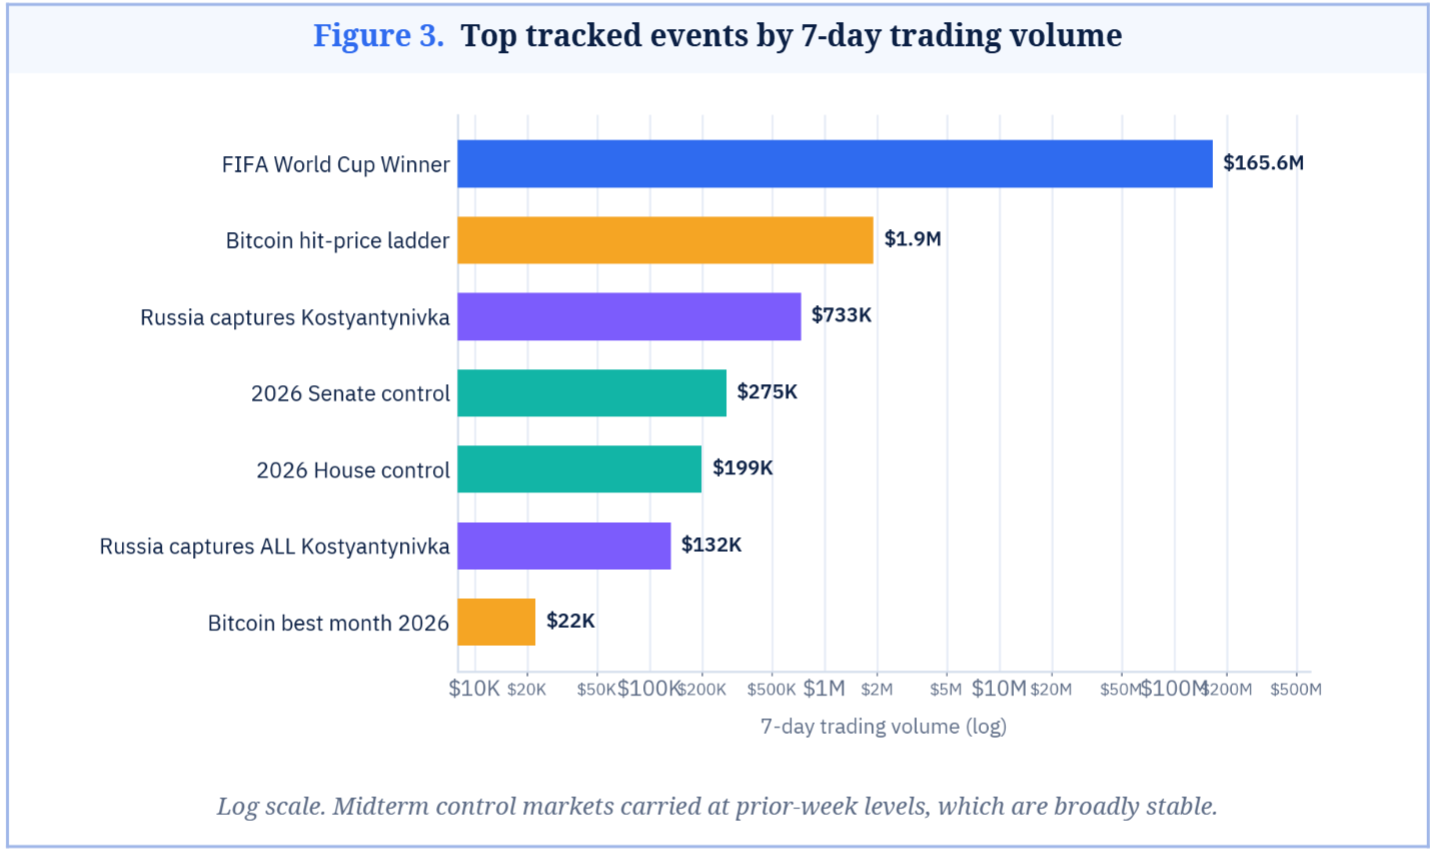
On Polymarket, the World Cup out-traded the entire rest of the tracked board by roughly 87-to-1, but the interesting movement is below it. The Bitcoin hit-price ladder ($1.9M) held flat week-on-week even as crypto stayed quiet, because its flow is now dominated by downside hedges — the market is pricing a real chance BTC revisits the $40–55K band this year, not chasing upside. The Kostyantynivka complex ($733K) jumped in importance not on volume but on velocity: a Russian battlefield advance repriced its near-dated contracts violently mid-week, the clearest example on the board of a market moving because the underlying world moved.
Ranked by the week's turnover, the board is dominated by one event:
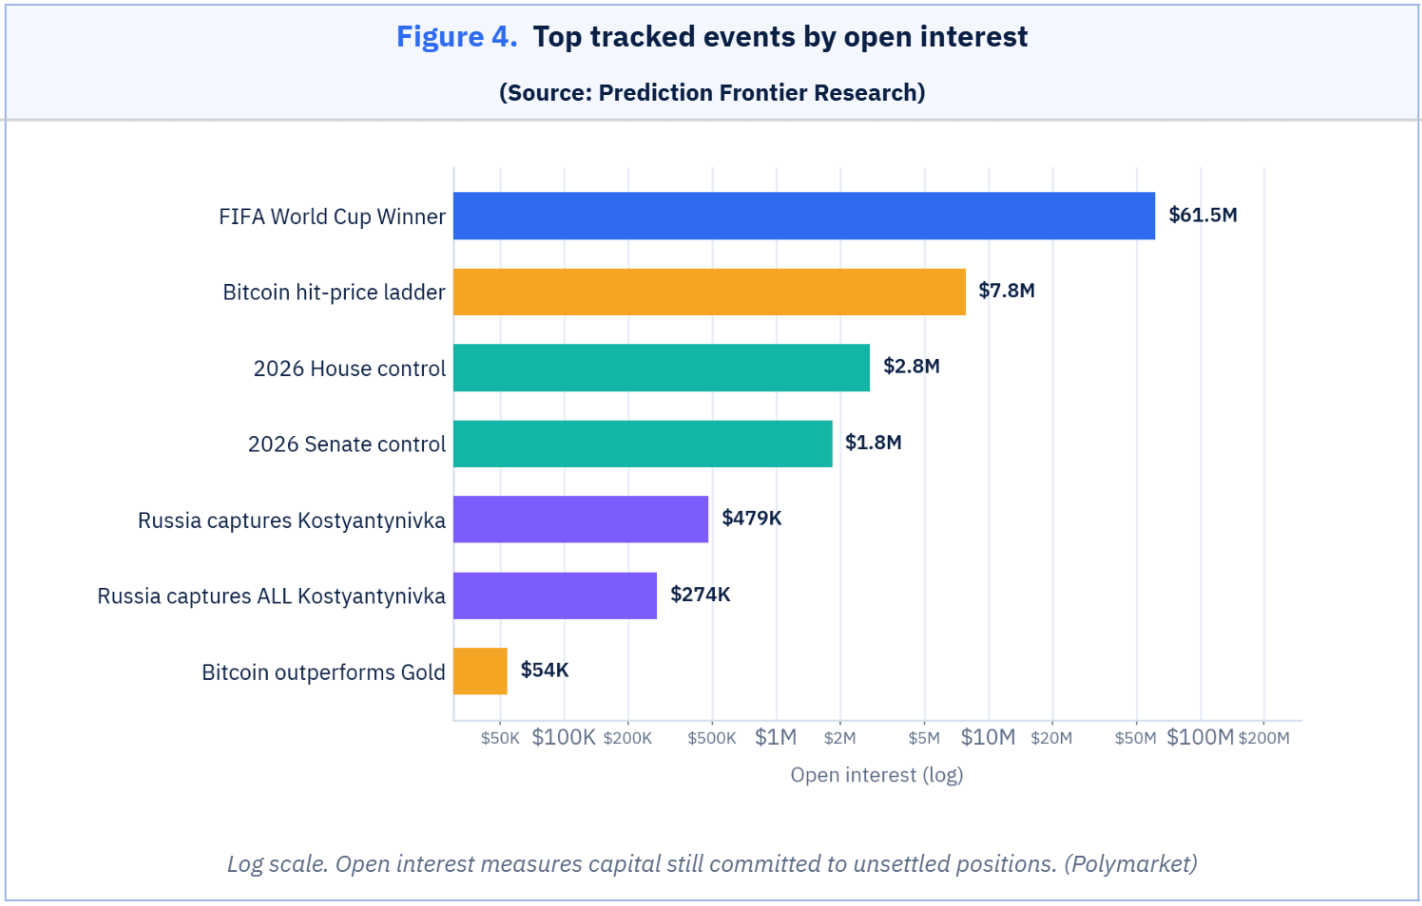
Ranked by committed capital instead of turnover, the board inverts. The 2026 House-control market holds $2.77M of open interest on just ~$199K of weekly volume — a 14-to-1 ratio that marks money parked months ahead of November, not actively traded. The World Cup is the opposite, its open interest turning over fast as the bracket resolves; that ratio, more than headline volume, tells an allocator whether a price reflects fresh information or stale conviction.
Open interest reorders the same events by how much capital stays parked:
Sports vs. everything else, at the market level
The two most-traded single markets of the week on Polymarket belonged to teams that are now out. Norway ($37.6M) and Switzerland ($37.0M) out-traded all four semifinalists because longshot lottery-ticket flow kept pouring in right up until the quarterfinals eliminated them — and elimination itself triggered a final burst of position-closing volume. It is a clean illustration of why volume and probability diverge: the cheapest tickets attract the most trades. Among the survivors, Argentina ($31.3M) drew the heaviest flow, a likely mix of Messi's farewell narrative and genuine uncertainty about a holder that has needed extra time twice.
At the single-market level, the sports board splits cleanly by who survived:
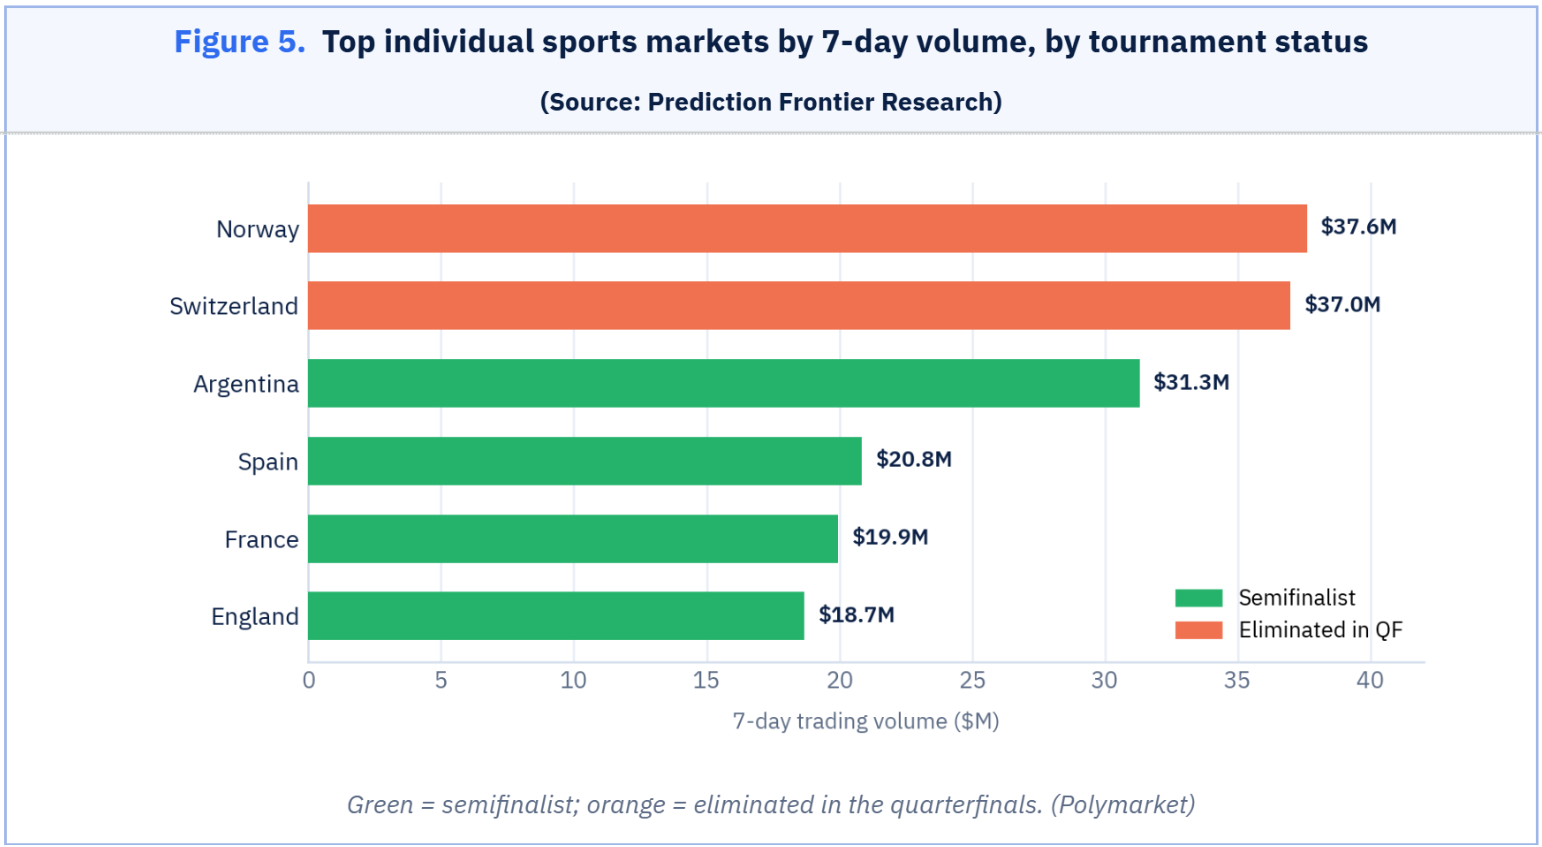
Meanwhile, two stories dominated the non-sports categories. The Bitcoin cluster is all downside: the $50K, $45K and $55K dip markets took the most flow because traders are hedging a soft 2026 tape, not betting on new highs — the market implies BTC is trading in the mid-$60Ks with meaningful room below. The Kostyantynivka cluster is all news: the July-31 partial-capture contract absorbed $89K while leaping 19.5 points in a day, and the August contract jumped 24 points, both driven by a concrete Russian advance on the town that forced the market to re-rate its timeline in real time.
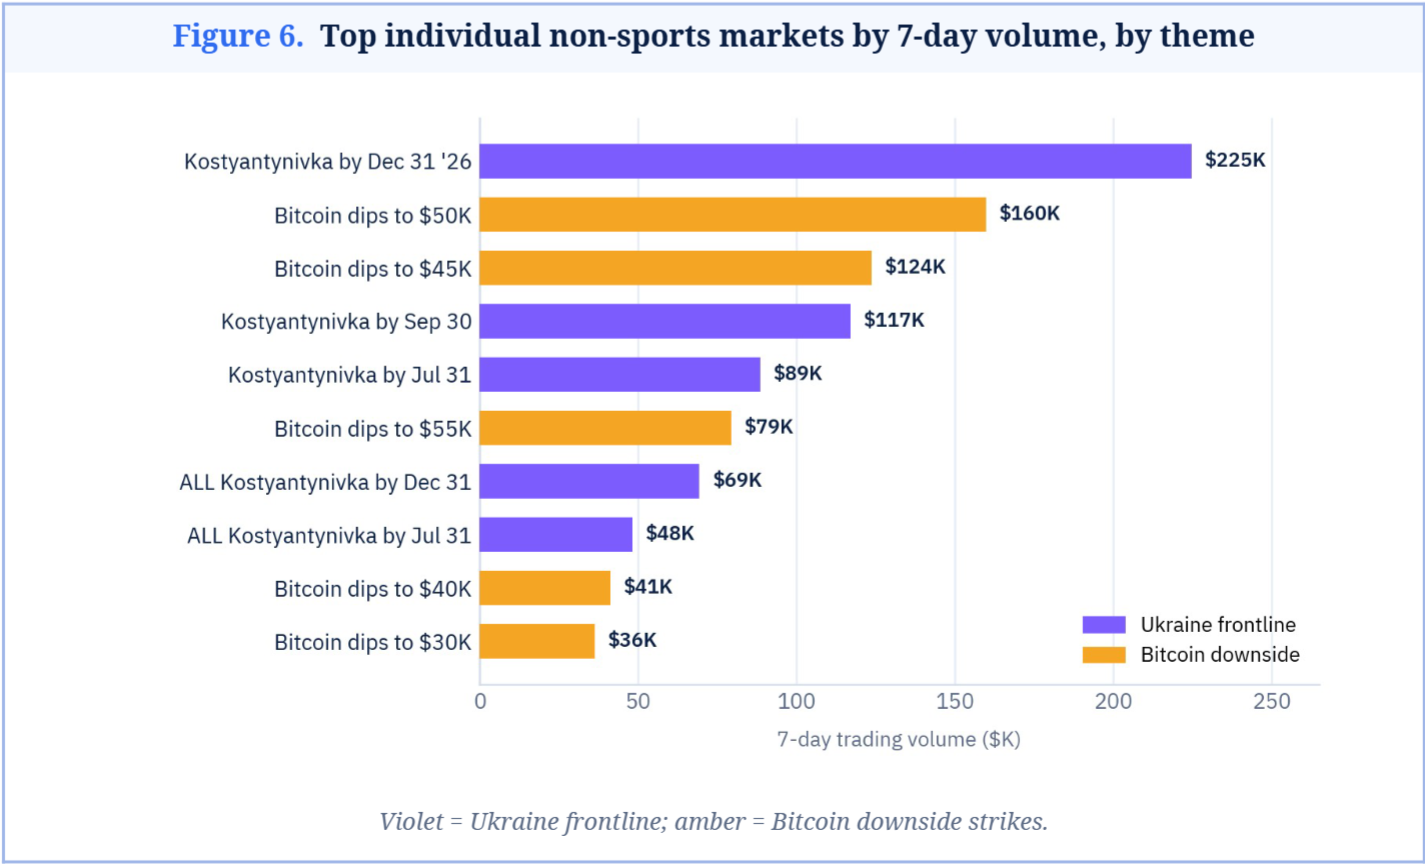
Top Markets of the Week
Resolved to individual markets, the overall top of the board is again entirely sports — no crypto, political or geopolitical market comes within two orders of magnitude of a World Cup contract. That total dominance is the point: the World Cup has not merely led prediction-market flow this month, it has crowded everything else off the market-level table.
# | Market (overall ranking, by 7-day volume) | 7-day vol | Status / odds |
1 | Norway wins the World Cup | $37.6M | Out (QF) · 6% |
2 | Switzerland wins the World Cup | $37.0M | Out (QF) · 2.2% |
3 | Argentina wins the World Cup | $31.3M | Semifinal · 18.3% |
4 | Spain wins the World Cup | $20.8M | Semifinal · 20.5% |
5 | France wins the World Cup | $20.0M | Semifinal · 38.9% |
6 | England wins the World Cup | $18.7M | Semifinal · 21.5% |
7 | Kostyantynivka captured by Dec 31 '26 | $225K | Geopolitics · 95.1% |
8 | Bitcoin dips to $50K in 2026 | $160K | Crypto · 41.5% |
9 | Bitcoin dips to $45K in 2026 | $124K | Crypto · 28.5% |
10 | Kostyantynivka captured by Sep 30 '26 | $117K | Geopolitics · 87% |
The sports-only ranking is the top six lines above; the ex-sports ranking is lines seven onward, and the drop between them — from $18.7M to $225K, a factor of 83 — is the single cleanest measure of how lopsided the week was. For a trader, the implication is unchanged from last week but sharper: the only markets deep enough to absorb size are the ones where edges are hardest to find, and the markets where an information edge is plausible (Ukraine frontline, Bitcoin downside) are probably too thin to trade at scale without moving the price.
Best Markets: The Institutional Liquidity Map
Each bubble is a live market: horizontal position is 7-day volume, vertical is implied probability, and bubble size is order-book depth. The shaded band marks the $10M-plus-per-week zone — the only region where an institutional order fills without moving the price. Bubbles are numbered by rank; the legend beneath each map carries the exact figures.
On the overall map, only World Cup contenders reach the institutional band:
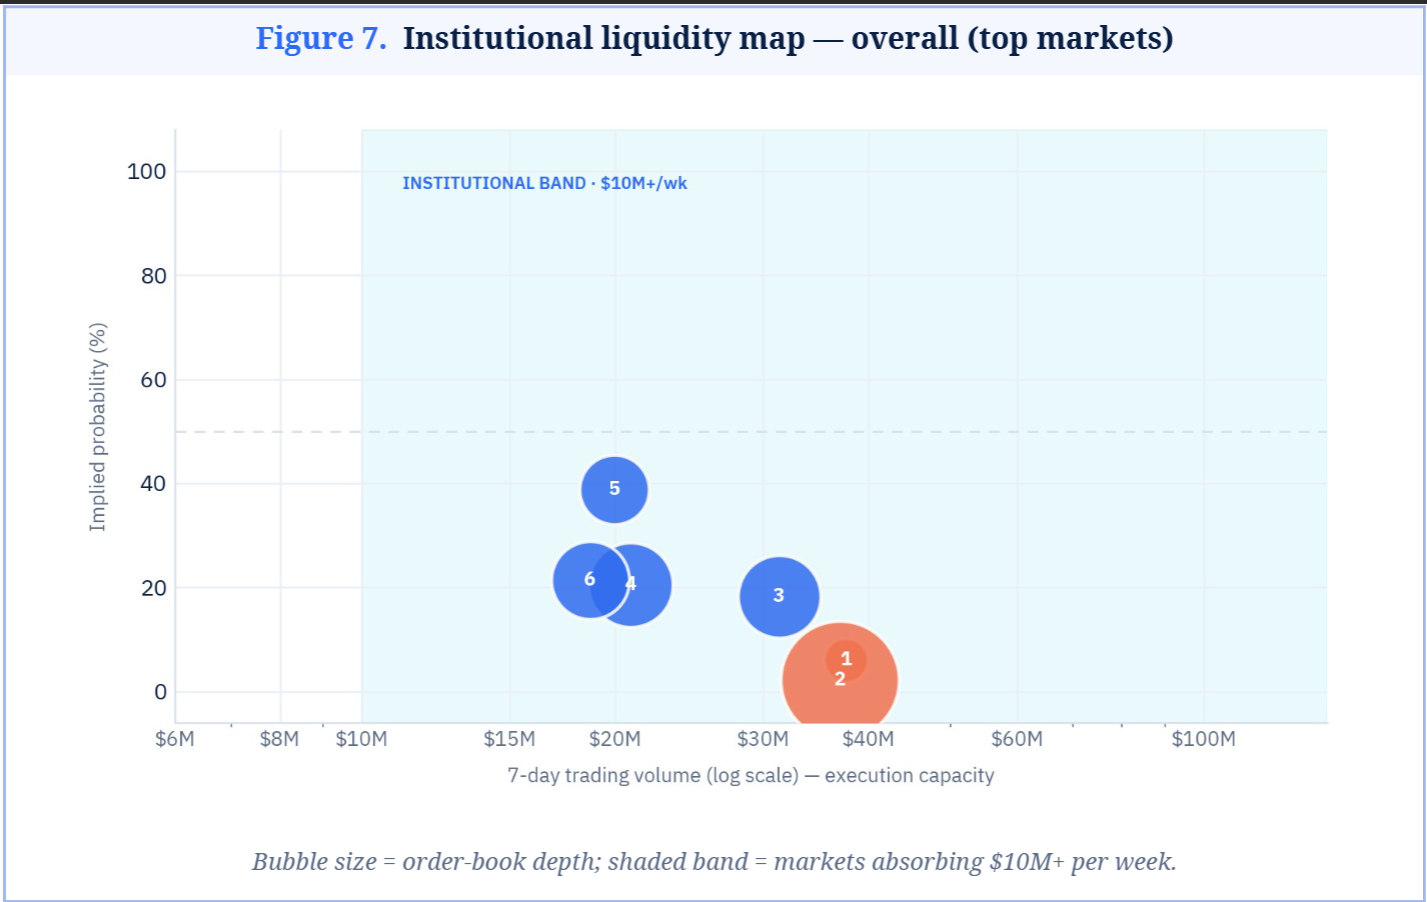
1 Norway (out) — $37.6M · 6%→0 · $5.5M book | 4 Spain — $20.8M · 20.5% · $7.8M book |
2 Switzerland (out) — $37.0M · 2.2%→0 · $12.5M book | 5 France — $20.0M · 38.9% · $6.7M book |
3 Argentina — $31.3M · 18.3% · $7.7M book | 6 England — $18.7M · 21.5% · $7.3M book |
The institutional band is emptying as the tournament resolves. A week ago, eight contender books sat inside it; now the four survivors anchor it and the two most heavily traded names in it — Norway and Switzerland — are already eliminated, their depth about to vanish. The actionable read for an allocator is that executable World Cup liquidity is now concentrated in four books totalling roughly $29M, and it will thin further with each semifinal. France, at 38.9% with a $6.7M book, is the last market on the platform where a six-figure directional position on the tournament can still be built and unwound cleanly.
Removing sports rescales the map by three orders of magnitude:
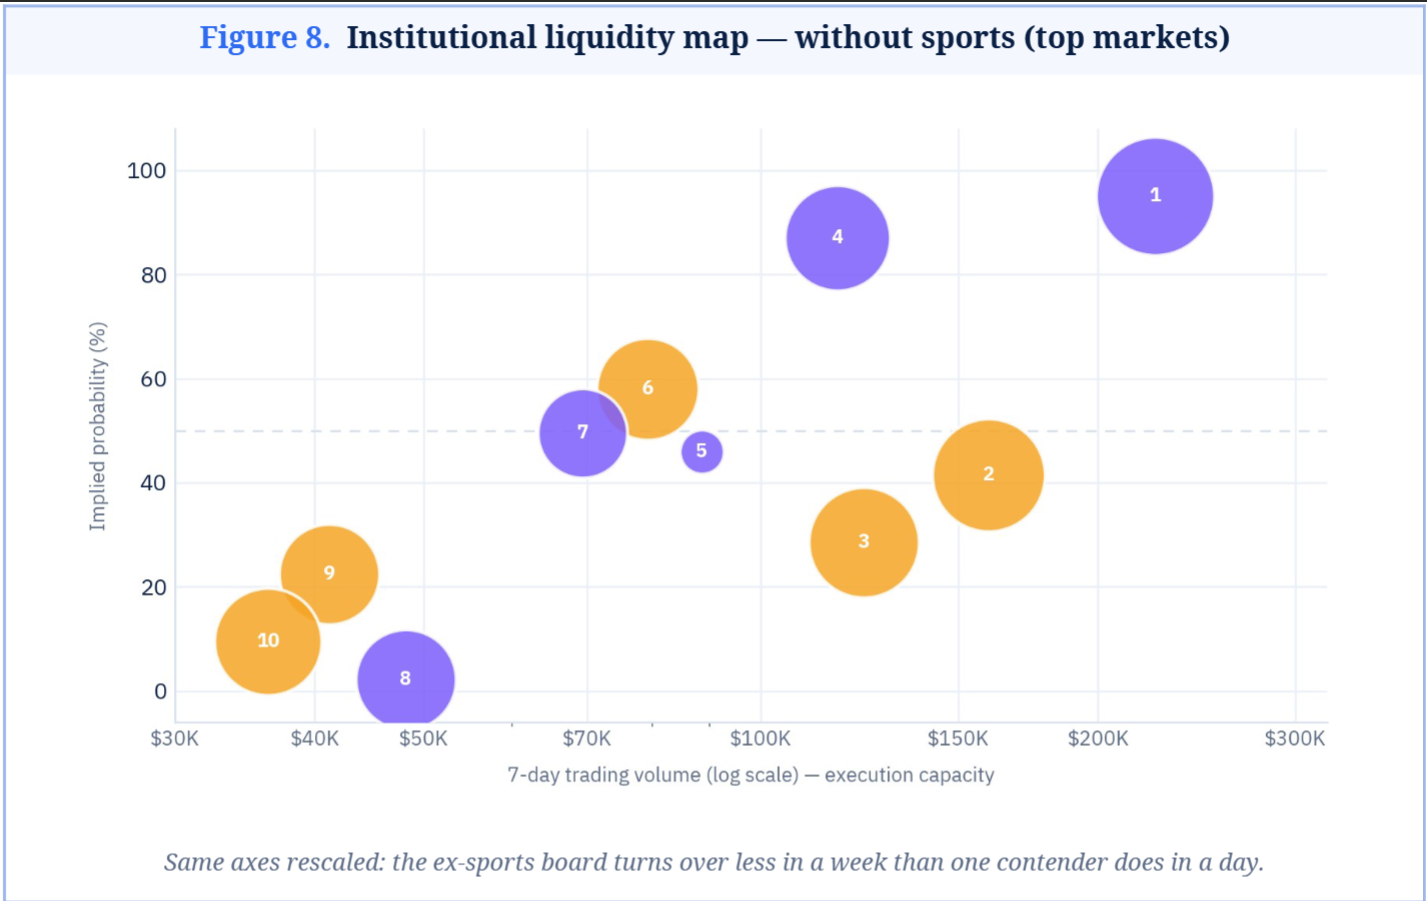
1 Kost. Dec 31 '26 — $225K · 95.1% · $135K book | 5 Kost. Jul 31 — $89K · 46% · $15K book |
2 Bitcoin dips $50K — $160K · 41.5% · $107K book | 6 Bitcoin dips $55K — $79K · 58% · $70K book |
3 Bitcoin dips $45K — $124K · 28.5% · $96K book | 7 ALL Kost. Dec 31 — $69K · 49.5% · $45K book |
4 Kost. Sep 30 — $117K · 87% · $79K book | 8 Bitcoin dips $40K — $41K · 22.5% · $66K book |
Strip out the World Cup, and the entire board turns over less in a week than the French market does in a day. The structure is still informative: the Bitcoin $50K-dip market (2) sits near a coin-flip with a six-figure book, the cleanest macro hedge on the ex-sports board, while the Kostyantynivka July-31 contract (5) is the opposite — high flow relative to its thin $15K book, which is exactly why a single frontline report can move it 19 points in a day. Anything in the bottom-left of this map is a headline-driven market, not an executable one.
Capital Infrastructure
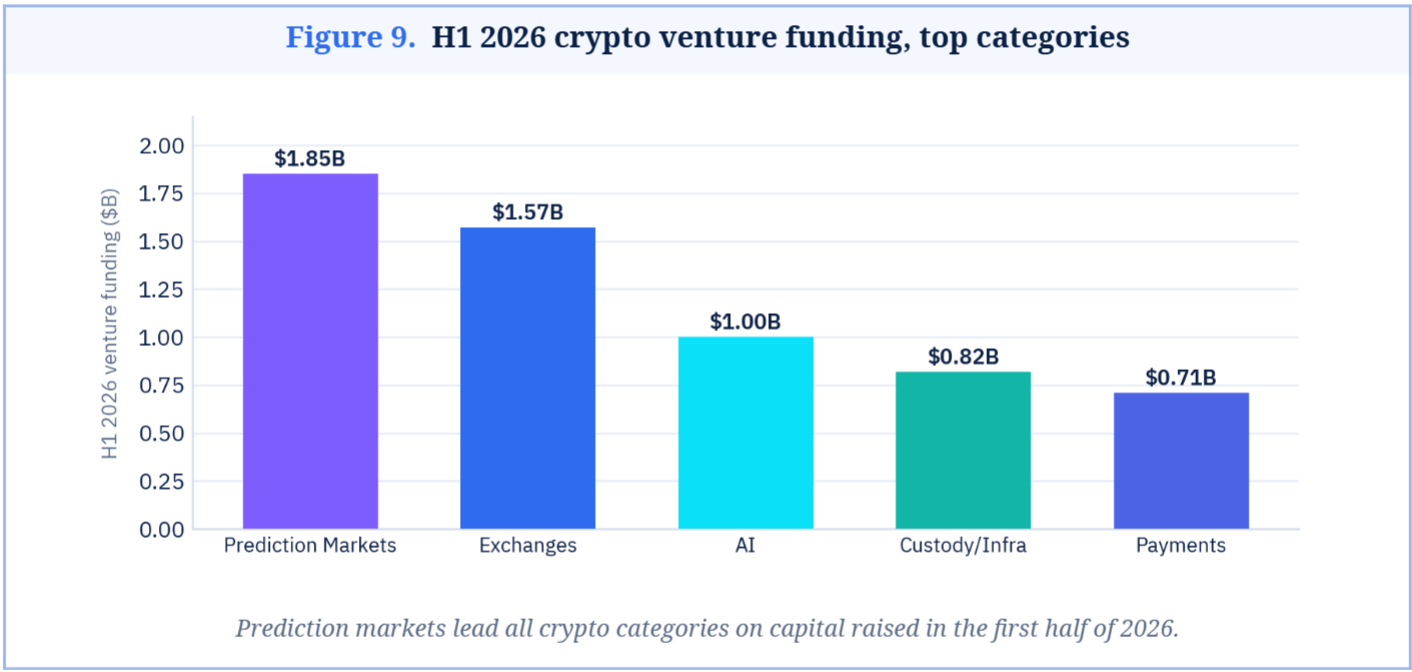
Prediction markets were the single most-funded crypto category in the first half of 2026 at $1.85B, ahead of exchanges ($1.57B) and AI ($1.0B). The reason is visible in this week's venue data rather than in the funding table: capital is underwriting distribution, not just the incumbents. Kalshi's $1.2B and Polymarket's $600M rounds dominate the headlines, but the venues climbing the Dune ladder behind them — and new distribution-led entrants — are the template investors are now paying for.
Capital has already voted on the category:
The strategic implication for Polymarket's leadership ambition is double-edged. It sits second on all-time notional and first on political open interest, but the World Cup has shown that sports flow — where it trails Kalshi and where entrants are aiming — is the growth engine. If tournament flow mean-reverts after the July 19 final, the venues that kept users through distribution, not event design, will hold the gains.
The World Cup Deep Dive
The quarterfinals went entirely to form. France beat Morocco 2–0, Spain edged Belgium 2–1, England came from behind to beat Norway 2–1 after extra time, and holders Argentina survived Switzerland 3–1, also in extra time. The last four — France, Spain, England, Argentina — are the top four FIFA-ranked teams, a World Cup first. Because the favourites won, the market spent the week concentrating on probability rather than redistributing it.
The survivors' odds moved sharply as eliminated teams' probability was reallocated:
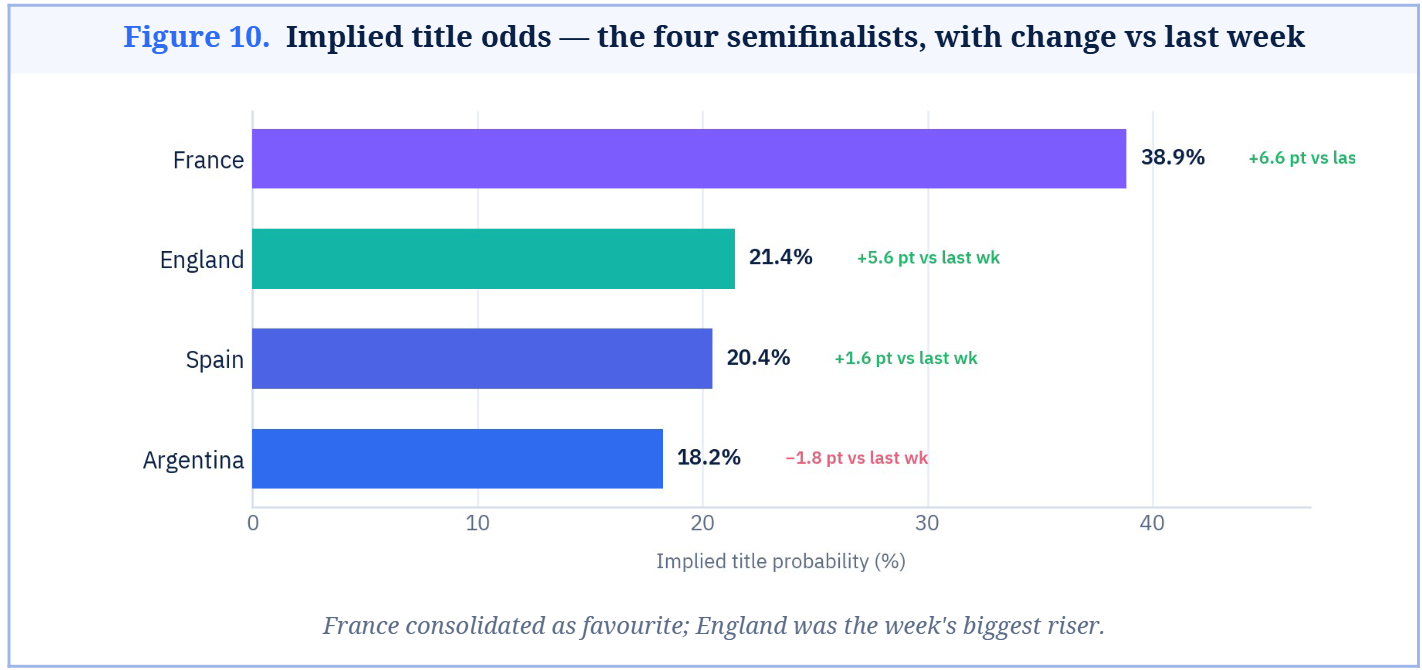
France consolidated as the clear favourite at 38.9% (from 32.2%), absorbing most of the ~14 points of implied probability freed by the four eliminations, because its 2–0 dismissal of Morocco was the tournament's most convincing quarterfinal and Kylian Mbappé became France's record scorer along the way. England was the week's biggest riser, +6.5 points in a single day to 21.5%, when Bellingham's extra-time brace ended Haaland's Norway — the market had priced Norway as a live threat, so removing it re-rated England sharply.
Argentina actually drifted lower (20.0% → 18.3%) despite winning: two straight extra-time escapes told the market the holders are beatable, and their semifinal draw against a surging England is the bracket's hardest.
Round of 16 vs. quarterfinals — how the trading changed
Comparing the two knockout rounds, each metric fell for a specific reason:
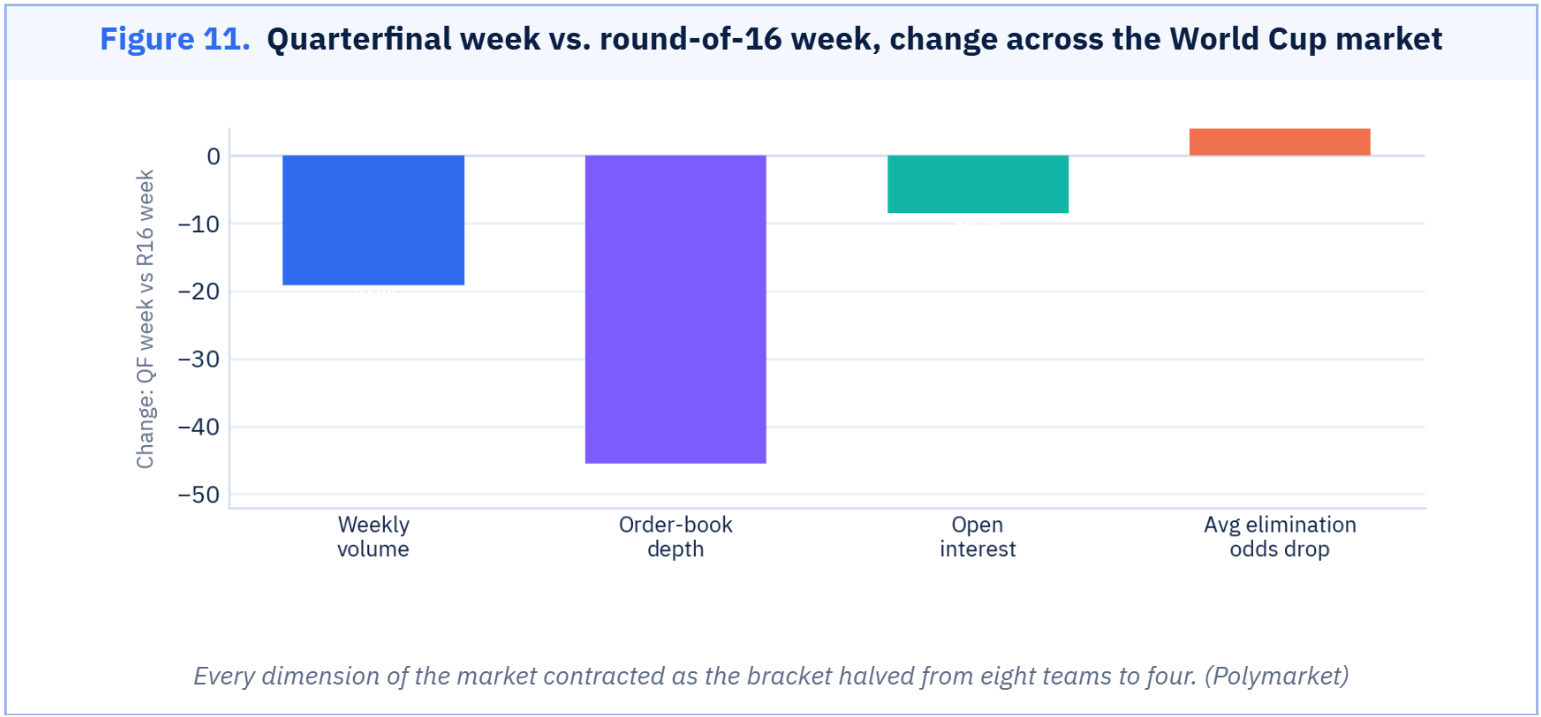
Every dimension of the market contracted from the round of 16 to the quarterfinals, and each for a specific reason. Weekly volume fell 19% because the round staged four matches, not eight. Order-book depth fell 46% — far faster than volume — because eliminating four contenders removed their entire books at once, and the eliminated Swiss book alone was $12.5M. Open interest fell only 8.5%, the slowest of the three, because the four survivors carry the bulk of committed capital forward. And elimination-day odds destruction fell 41% (from a 5.3-point average to 3.1) — the cleanest signal of all, because the round of 16 knocked out favourites like Brazil and Portugal, while the quarterfinals only removed longshots.
The per-team elimination view makes the round-over-round shift concrete:
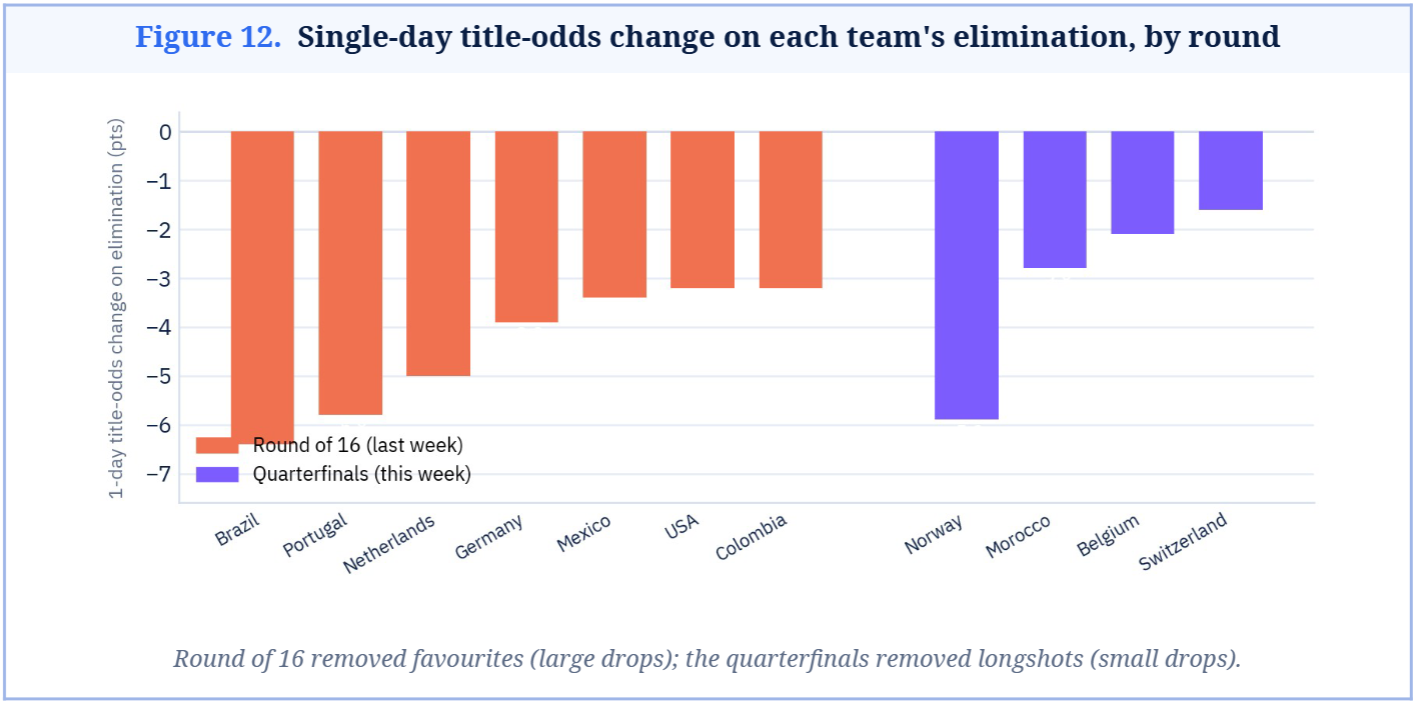
In the round of 16, Brazil's exit erased 6.4 points of title probability in a day, and Portugal's 5.8. In the quarterfinals, only Norway's exit (−5.9) came close — a special case, since Haaland's Norway had been the tournament's breakout longshot. The other three exits erased 1.6 to 2.8 points each. The lower probability at risk per match is why settlement was calmer, and spreads stayed tighter than the round of 16's chaos.
The volume-share split, before and after narrowing to the last four:
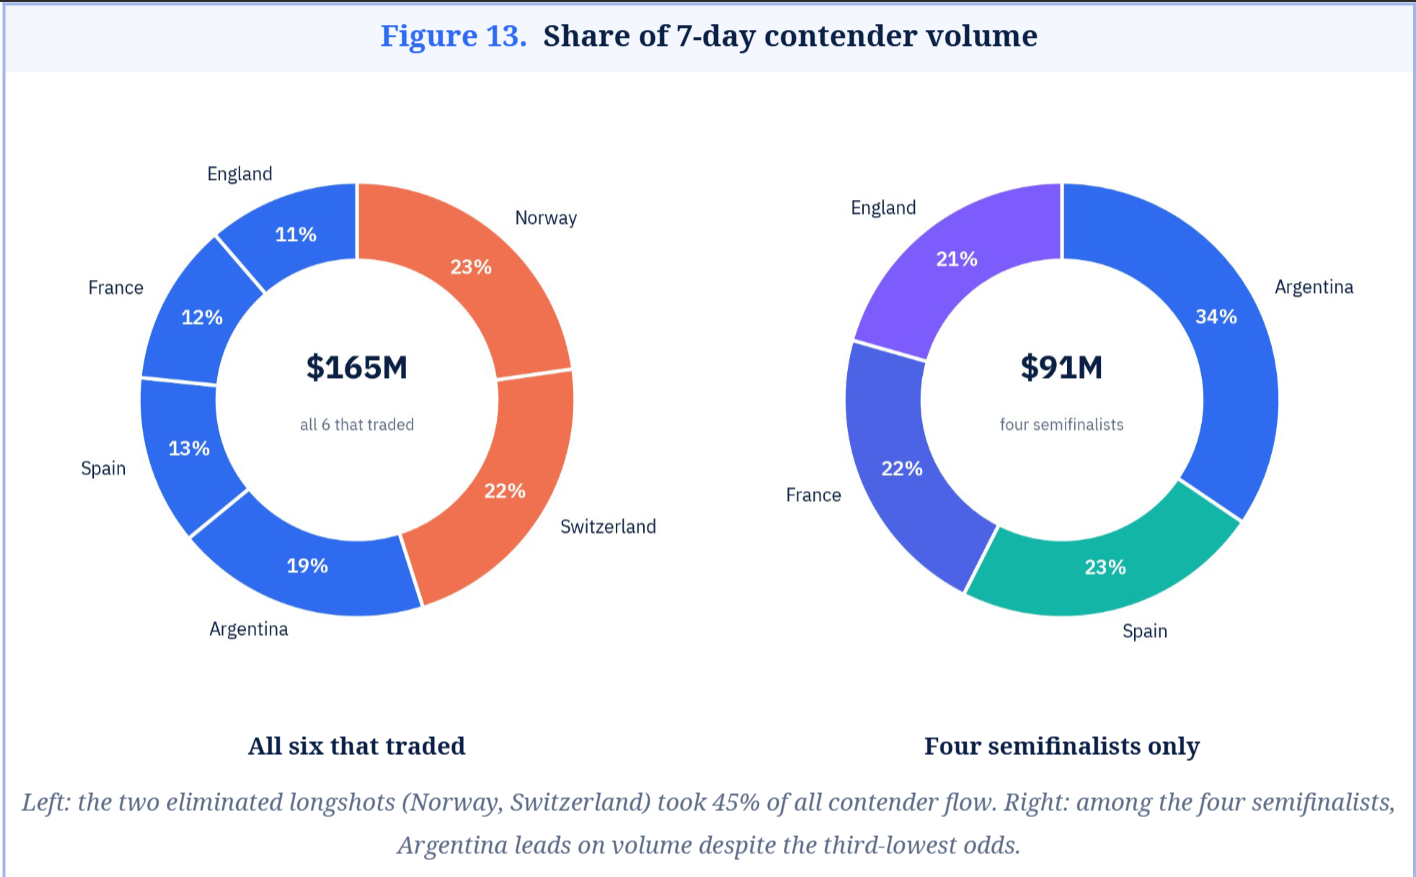
Polymarket’s volume-share donut captures the week's central irony: the two eliminated longshots, Norway and Switzerland, took 45% of all contender flow between them, more than the four semifinalists' combined share on several measures.
For the semifinals, the survivors' prices — set by comparatively patient capital — are the more information-rich; residual longshot pricing should be treated as demand-driven noise.
What to Look Out For Next Week
The tournament's endgame and a handful of non-sports catalysts will drive next week's flow. Each item below notes what could move and why it matters.
Two semifinals, then the final. France vs. Spain (Dallas, July 14) and England vs. Argentina (Atlanta, July 15) set up the July 19 final at MetLife. Each result settles 15–30+ points of title probability in one evening and halves the executable book again — expect the sharpest order-book thinning of the tournament and the widest spreads of the cycle on the losing semifinalists.
The post-final volume test. The week after July 19 is the first clean read on how much of the tournament's flow was World Cup-specific. A materially higher baseline than pre-June levels confirms the sport-as-acquisition thesis; mean-reversion confirms the 19% weekly drop was the leading edge of a normalisation.
Kostyantynivka's July 31 resolution. The partial-capture market sits at 46% after a 19.5-point weekly jump; every frontline map update reprices it, and its thin $15K book means each update moves it hard. It is the most news-sensitive contract on the non-sports board.
Bitcoin's downside ladder. The $50K-dip market at 41.5% is the closest thing to a live macro coin-flip; a decisive BTC move resolves the cluster's flow and signals whether crypto re-engages prediction markets as the World Cup fades.
The chasing pack on Dune. Opinion ($26B all-time) and the on-chain venues are the ones to watch for share gains as sports flow rotates out — whether the challengers hold volume without a World Cup tailwind is the structural question for H2.
Rothera's second month. June was a launch spike on the routed Robinhood flow. Whether Rothera holds ~7% of US volume in July — its first full month without a World Cup tailwind — will show whether distribution-led entrants are structural share-takers or event-driven blips.
Conclusion
The week resolves to one clean fact: liquidity and information are decoupling. World Cup volume fell 19%, order-book depth fell 46%, but open interest only fell 8.5% — capital held its positions while casual flow evaporated, which is a sign of a market concentrating rather than losing conviction. What's harder to see in the headline numbers is where the real edge sat all week: not in the $37M Norway or Switzerland books, both dead the moment those teams lost, but in a $15K Kostyantynivka contract that moved 19.5 points on a single frontline update. Depth and relevance aren't the same thing, and this week's board made that unusually explicit.
The wider context sharpens the point. $1.85B of H1 crypto venture funding went into prediction markets — more than exchanges, more than AI — and Rothera turned that money into 7% of US volume in one month by plugging into Robinhood's user base rather than improving the product. Distribution, not contract design, is what investors ought to be eyeing right now. For traders, that means treating the two ends of the board as different instruments: the four surviving World Cup books are currently where you can move size, and the thin geopolitical and crypto contracts are where a genuine edge sat unpriced for days — right up until the moment a headline collapsed the gap.
APPENDIX
Sources & Methodology
Figure sources
Figure 1 — All-time notional volume by venue — Dune Analytics, dashboard “Prediction Markets” by datadashboards (query 6696130). Notional counts contracts, not dollars. ‘Other’ = Overtime, Gemini, Myriad, ForecastEx.
Figure 2 — May→June monthly notional — The Block data dashboard and Dune Analytics, as reported by CNBC (June 2026).
Figure 3 — Top events by 7-day volume — Polymarket live data via the Radion App connector, pulled July 13, 2026 (trailing 7 days). Midterm-control markets carried at prior-week levels.
Figure 4 — Top events by open interest — Polymarket via Radion App, July 13, 2026.
Figure 5 — Top sports markets — Polymarket World Cup Winner market via Radion App, July 13, 2026.
Figure 6 — Top non-sports markets — Polymarket via Radion App (Bitcoin and Kostyantynivka complexes), July 13, 2026.
Top Markets table (Section 3) — Polymarket via Radion App, July 13, 2026.
Figure 7 — Liquidity map, overall — Polymarket via Radion App; bubble size = order-book depth.
Figure 8 — Liquidity map, without sports — Polymarket via Radion App.
Figure 9 — H1 2026 venture funding — CryptoRank H1 2026 research; round detail via BitcoinWorld’s H1 funding roundup.
Figure 10 — Semifinalist title odds — Polymarket World Cup Winner market via Radion App, July 13, 2026.
Figure 11 — R16 vs. QF change — Polymarket via Radion App; the July 2–9 and July 6–13 windows.
Figure 12 — Elimination odds change — Polymarket via Radion App.
Figure 13 — Contender volume share (both donuts) — Polymarket via Radion App, July 6–13, 2026.
Match results & narrative — Yahoo Sports, FOX Sports and ESPN quarterfinal reports (July 9–11, 2026).
Venture & venue context — CNBC and Bank of America (Rothera); The Block (Polymarket US); CryptoRank (H1 funding).
Methodology & disclosures
Polymarket data was pulled live via the RadionApp2 connector on July 13, 2026, covering rolling 7-day, 30-day and lifetime volumes, open interest and order-book liquidity per market/event; the trailing-7-day window covers July 6–13. Top boards are rebuilt each week from a fresh sweep of the highest-activity live complexes across sports, crypto, geopolitics and US politics; Polymarket exposes no global volume-sorted index, so markets outside the swept universe may exceed some entries. Cross-venue figures are drawn from the Dune Analytics prediction-markets dashboard and are cumulative notional volume unless stated; notional counts contracts and is not directly comparable to dollar volume across venues. Venues measure volume using differing methodologies, so cross-venue totals are indicative. Prediction Frontier does not provide investment advice. © 2026 Prediction Frontier.